Our Monitoring Efforts
KAQI has been monitoring ambient particulate matter atop the Andy Murphy Neighborhood Center in Midtown Kingston since January 2020. We’ve learned a lot in that time, both about air quality in the City of Kingston, and how to better refine our monitoring capabilities! Our monitoring has started at a relatively small scale, but we are working toward something bigger: being able to have regional air quality data accessible to every Kingston resident, as well as inform our community on how to better protect public health. This will take the form of a regularly-updated data stream to be accessed online. In addition, we recognize the importance of the microscale nature of air quality and its potential to shift dramatically over particular areas or neighborhoods. We have begun to institute a more expanded monitoring program which will include neighborhood-by-neighborhood level monitoring through cooperation with Kingston residents. These updates to the Kingston Air Quality Initiative are not far off. However, as we prepare to phase in these other components, we hope to give you a sample of our monitoring capabilities at present.
A Glimpse at 2020

The above figure represents daily averages in Particulate Matter 2.5 (PM 2.5) for year one of ambient monitoring in the City of Kingston. Each red point corresponds to the mean (average) PM2.5 concentration for that day in micrograms per cubic meter. The instrument by which these concentrations are collected logs particulate counts on a minute-by-minute basis. The orange dotted line represents the U.S. Environmental Protection Agency 24-hour PM2.5 standard of 35 micrograms per cubic meter (µg/m³). According to this documentation, an area meets the above standard if the 98th percentile of 24-hour PM2.5 concentrations in one year, averaged over a period of three years, is below 35 micrograms/cubic meter. Given what we see above, it is reasonable to assume we are on track to meet this standard. However, we must take into consideration the more minute air quality patterns that occur from neighborhood to neighborhood. In the near future, continuous monitoring atop the Andy Murphy Center will complement additional air quality sensors as we begin to expand our analysis into different Kingston neighborhoods. For more in-depth explanations on data procurement and preparation, click here.

When monitoring air quality, it is imperative to be taking regional meteorology into account. This allows proper context for patterns we may be observing. One of the most important parameters to keep track of is precipitation, as it can have a significant impact on the circulation of airborne particulates. A common phenomenon known as washing has been known to reduce the presence of particulates between 10-30 µg/m³ with just 5mm of rainfall (Ouyang et al., 2015). The above figure shows continuous mass counts for five different size classes (particle diameters) of particulate matter between 3pm on March 12, 2020 and 3pm on March 14, 2020. Rain began to fall on the evening of March 12 into the morning of the following day. The rainfall period, highlighted by a blue column, seems to correlate with a significant drop in PM2.5 and PM1.5. It may be reasonable to assume that the rainfall on this particular day “cleaned the air” in a sense. However, rainfall has been documented to have a variety of impacts on particulate concentration in the past (Sun et al., 2019, Zalakeviciute et al., 2018, Zhao et al., 2020).
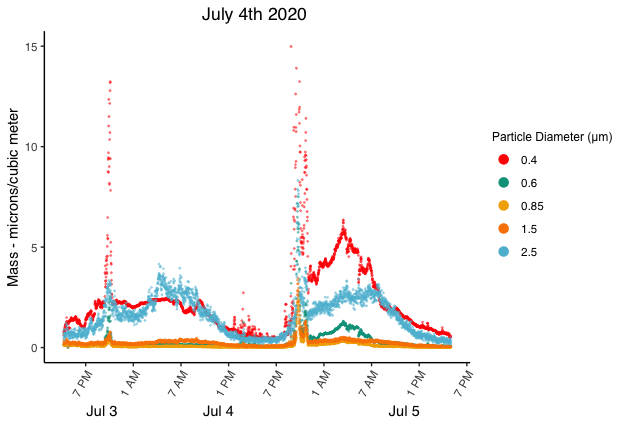
Something else to pay proper attention to when attempting to make sense of these data is extraneous circumstance. The above figure shows significant spikes in both PM2.5 and PM0.4 on two separate occasions. However, when we examine more closely, we see that both of these spikes occurred on the evenings of July 3 and 4. We know that all around Kingston on both of those nights a wide variety of festivities occurred, namely, backyard fireworks. It would not be unreasonable to ascertain that these spikes in particulates came as a result of the residual exhaust from the launching of these fireworks. A number of studies have shown that fine particulate matter increases during the lighting of fireworks and firecrackers while showing a decay period as well (Seidel & Burnbaum, 2015, Lin 2016, Hoyos et al., 2019 ). Luckily, the Kingston spikes don’t appear to surpass the EPA’s 24-hour threshold and the period of July 3-5 does not appear particularly significant according to the 24-hour averages two figures up. These spikes do, however, serve as a testament to the sensitivity of our monitoring network which will continue to grow in the near future.
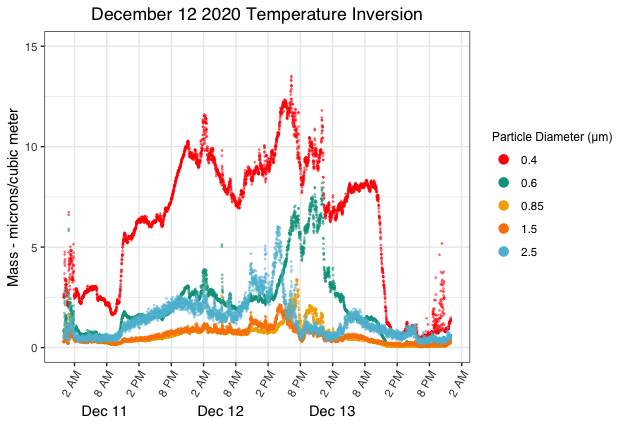
Temperature inversions have the potential to exacerbate air pollution by allowing cooler air to be trapped closer to the surface of the earth by a layer of warm air at higher elevation. As a result, emissions end up dispersing horizontally instead of vertically which leaves us susceptible to breathing them in. Thanks to publicly accessible data by federal agencies such as NOAA and state initiatives such as NYS Mesonet, we are able to determine if we are experiencing a temperature inversion in our region. We have confirmed from these data that on the day of December 12, our region of the Hudson Valley experienced one of these temperature inversions. The above figure outlines the behavior of airborne particulates at our sampling site during this time, with spikes in various size classes beginning in the afternoon and not fully decaying until early the following morning. A number of studies have linked occurrences of temperature inversions to increases in particle pollution (Wallace & Kanaraglou 2009, Palarz & Celinski-Myslaw 2017, Trinh et al., 2018). Others have identified discrepancies within this relationship in cities with varying topographic and spatial distributions. However, these results often seem to indicate that low-lying topographic regions experience worse air quality at the hand of inversions due to reduced slope winds and improper ventilation (Wallace et al., 2010, Edgerton et al., 1999, Romero et al., 1999).