Wildfire Pollution in Kingston -- July 23, 2021
Pollutants and Health Impacts
The Kingston Air Quality Initiative (KAQI), in collaboration with the Community Science Lab at Bard College, has been continuously tracking air quality with a focus on fine particulate matter in the City of Kingston since January of 2020. Approximately 80 wildfires are raging across Western North America at the moment. Wildfires in the western United States each season are driven by natural factors such as fuel availability, temperature, precipitation, wind, humidity, the location of lightning strikes, as well as anthropogenic factors.1 Aside from their notable ecological and socio-economic impacts,2,3 wildfires pose a huge threat to air quality. The combustion, and incomplete combustion, of biomass and wood leads to substantial atmospheric emissions of trace gases and a high number of mass concentrations of biomass burning aerosols, which significantly impact climate and air quality.4 Known pollutants attributed to wildfires include carbon monoxide (CO), nitrogen oxides (NOx), ozone (O3), volatile organic compounds (VOCs), particulate matter (PM), and black carbon (BC),5 all of which are associated with poor human health impacts with high exposure. The American Lung Association states breathing biomass smoke can cause coughing, wheezing, and difficulty breathing as well as pose a risk to shorten lives and cause both heart and asthma attacks.6
This past Tuesday into Wednesday, residents of New York noticed a particularly hazy quality to the air. It was difficult to see the other ends of bridges, and people noted experiencing shortness of breath. New York state officials issued an air quality warning for the entire state, due to fine particulate matter that had travelled over 3000 miles eastward and reached ground level in the tri-state area. Through the KAQI monitoring system, particulate matter readings that came in on Tuesday from our instrumentation were consistent with what was being observed around the rest of the local region.

Figure 1. Particulate matter readings from the past week atop the Andy Murphy Neighborhood Center in midtown, Kingston. This figure includes PM2.5 (red), PM1.0 (blue), and PM10.0 (green). Each class of PM is distinguished by the size range of particles it encompasses. PM2.5 includes all particles with a diameter of 2.5 microns or less. PM1.0 includes those of 1 micron or less, while PM10.0 includes all particles of 10 microns or less. It can be observed that the three trend together. However, PM2.5 poses the greatest risk to public health, as particles of this size and under cannot as easily exit the body once inhaled. For more information on particulate matter, please click here. Particulate measurements were collected using a Quant AQ Modulair-PM device supplied by the Bard Community Science Lab.
Figure 2. PM2.5 readings from the past week atop the Andy Murphy Neighborhood Center in midtown, Kingston. The above figure zooms in on PM2.5 as the pollutant of highest public health concern. The red dashed line represents a 24-hour threshold value of 35 ug/m3 with respect to public health established by the EPA. The heightened particulate matter readings observed on June 20 as a result of travelling smoke plumes from wildfires raging out west are marked in red. 
Transport
In the past, North American wildfire measurements have indicated that biomass combustion emissions can be transported over hundreds of kilometers such that local air quality is degraded even at great distances from fire locations.7 While in the air, the particulate matter is at the will of global and regional wind patterns, like the Westerlies and the Jet Stream, as well as under the influence of various meteorological factors (temperature, relative humidity, wind direction, and wind speed).
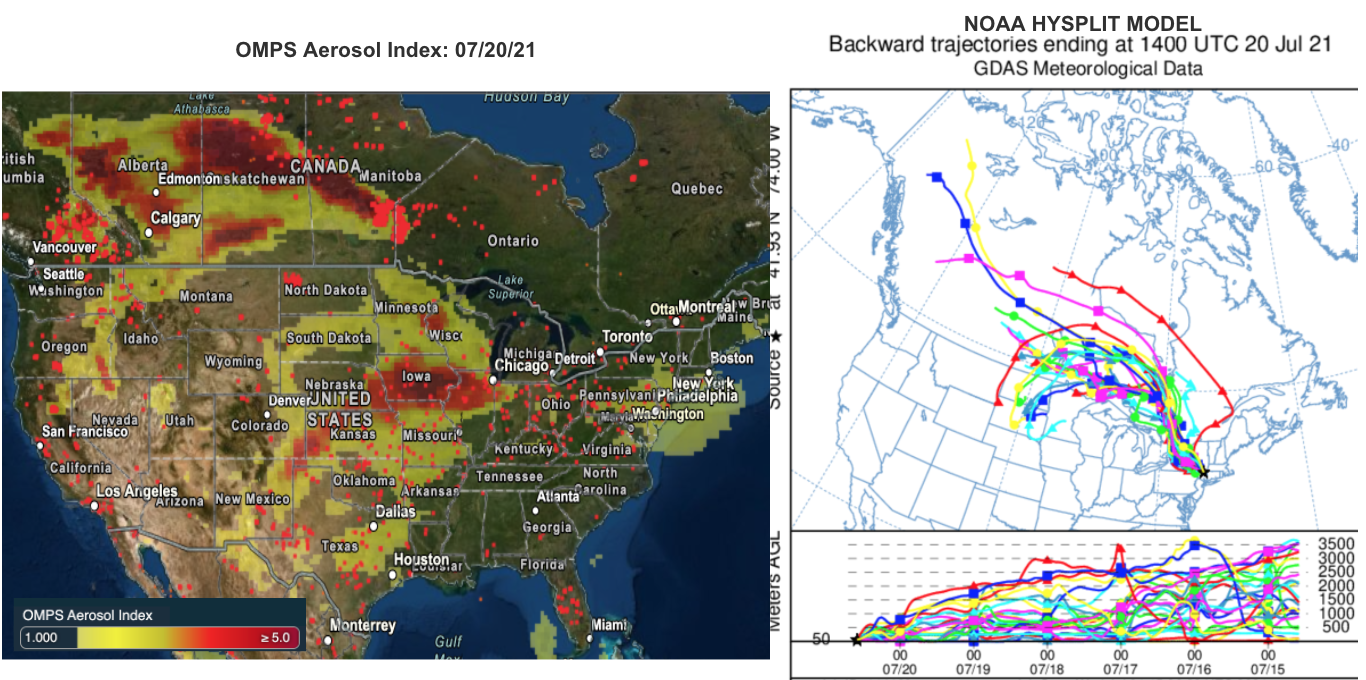
Figure 3. NASA’s Fire Information for Research Management (FIRMS) satellite incorporates both active wildfire hotspots represented by red points, and the OMPS Aerosol Index (AI), denoted by a scale of color ranging from yellow to red. The AI is used to indicate the presence of dust storms, biomass burning, and wildfires. Values of 0-5 indicate heavy concentrations of aerosols in the Lower Troposphere closer to ground level, where aerosols could reduce visibility and impact human health.
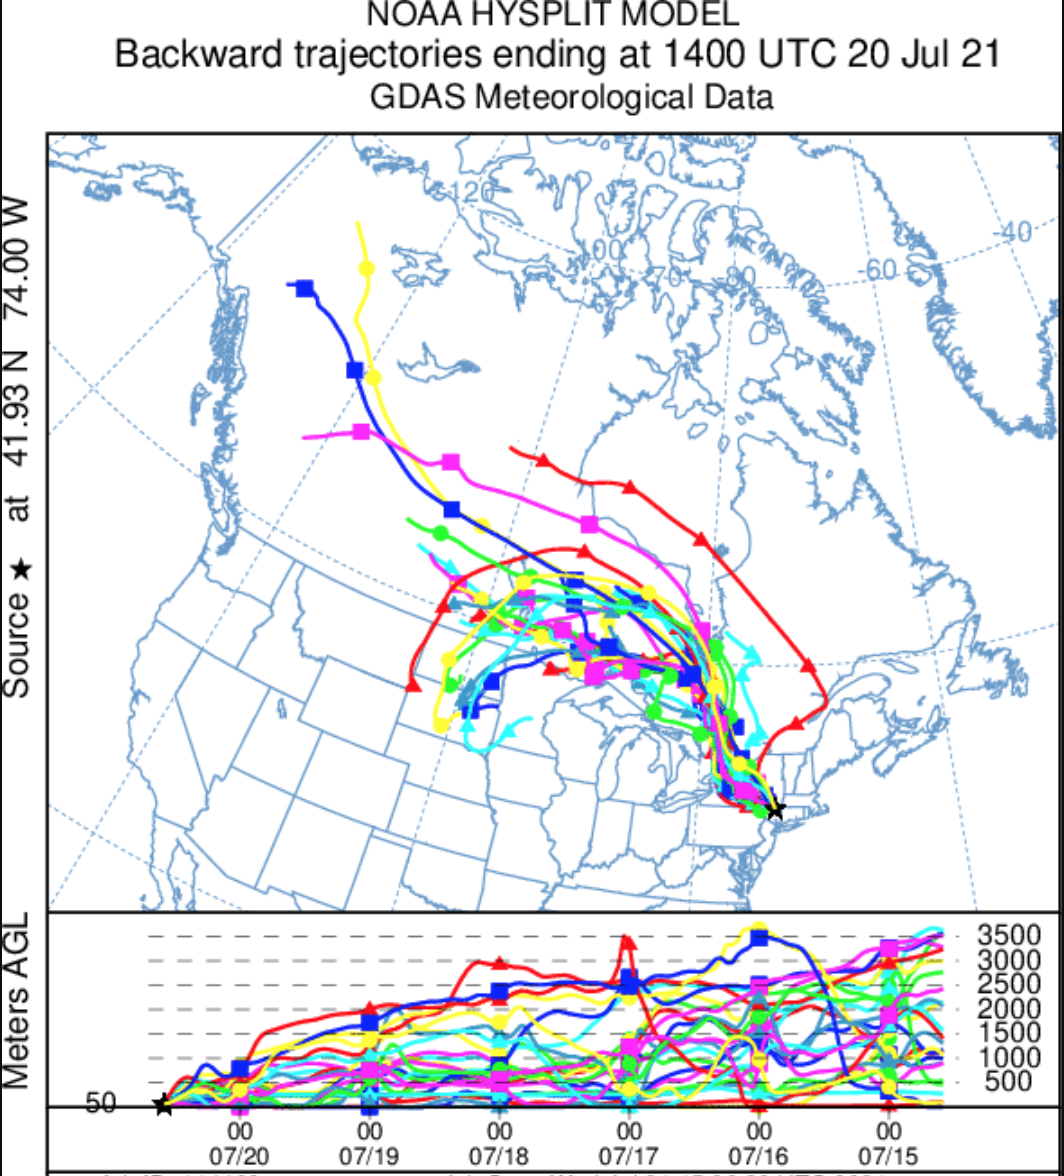
Figure 4. NOAA’s HYSPLIT Model projects the paths by which air traveled across the country to Kingston, NY. On July 7th, air packets originating in the midwest and parts of Canada, both areas of intense wildfires over the span of the past few weeks, traversed the country and deposited out of the upper Troposphere into the lower Troposphere, where any smoke related aerosols affecting ground level air quality.
Red Sun Phenomenon
The red sun phenomenon, which many New Yorkers witnessed Tuesday and Wednesday morning of this past week, occurs when the sun’s rays are obstructed by particulate matter in levels of the stratosphere, and has been associated with wildfire smoke particulates in the past.8 In this case, the presence of the smoke particles created from the West Coast wildfires were large enough to scatter a majority of the sun’s blue light rays, making the sun appear more red to the human eye. It would be typical to see this phenomenon in any moderately close proximity to an active wildfire site, but its continued presence on the East Coast demonstrates how large scale mechanisms play out to carry smoke, and other air pollution, across the country.

Figure 4. Image of the sun taken on July 20th off a boat on Hudson River, just outside of Kingston. Photo courtesy of Ilana Berger.
Takeaways
Airsheds do not abide by local, state, or national boundaries. In the larger scheme of climate change, it is a fact that wildfires will become more prevalent, burning longer and across wider ranges, thus creating larger and possibly more harmful smoke plumes with the capacity to travel greater distances and impact additional communities. Therefore, it is important to view large wildfire events not just through a local lens, but through a regional, national, and even a global one. Multiple studies have shown that the source of PM 2.5 matters.9,10 These studies have shown that PM 2.5 produced by wildfires or by burning wood is more dangerous to human health than that produced, for example, by vehicle emissions. A study from UC San Diego Scripps Institute was released very recently showing the PM 2.5 emitted by wildfire smoke results in up to 10% more respiratory admissions to hospitals than other sources of PM 2.5.11 This adds to the already existing body of evidence showing PM 2.5 from woodsmoke pollution in general to be more ecotoxic and more mutagenic than PM 2.5 from other sources, including vehicle emissions.
With predictions of worsening wildfires, we all may wonder how we can make a difference for the better. On the personal level, we can make a choice not to burn wood. Limiting the PM 2.5 and black carbon we emit at home is a manageable and tangible step toward bettering our air quality and mitigating both the effects, and, ultimately, the scope and frequency of wildfires.
References
-
Westerling, A. L., Gershunov, A., Brown, T. J., Cayan, D. R., & Dettinger, M. D. (2003). Climate and Wildfire in the Western United States. Bulletin of the American Meteorological Society, 84(5), 595–604. https://doi.org/10.1175/BAMS-84-5-595
-
Dennison, P. E., Brewer, S. C., Arnold, J. D., & Moritz, M. A. (2014). Large wildfire trends in the western United States, 1984-2011: DENNISON ET. AL.; LARGE WILDFIRE TRENDS IN THE WESTERN US. Geophysical Research Letters, 41(8), 2928–2933. https://doi.org/10.1002/2014GL059576
-
Steiner, J. L., Wetter, J., Robertson, S., Teet, S., Wang, J., Wu, X., Zhou, Y., Brown, D., & Xiao, X. (2020). Grassland Wildfires in the Southern Great Plains: Monitoring Ecological Impacts and Recovery. Remote Sensing, 12(4), 619. https://doi.org/10.3390/rs12040619
-
Zauscher, M. D., Wang, Y., Moore, M. J. K., Gaston, C. J., & Prather, K. A. (2013). Air Quality Impact and Physicochemical Aging of Biomass Burning Aerosols during the 2007 San Diego Wildfires. Environmental Science & Technology, 47(14), 7633–7643. https://doi.org/10.1021/es4004137
-
Wu, Y. (2018). Intra-continental wildfire smoke transport and impact on local air quality observed by ground-based and satellite remote sensing in New York City. Atmospheric Environment, 16. https://doi.org/10.1016/j.atmosenv.2018.06.006
-
Protect Your Health During Wildfires. (n.d.). 2. American Lung Association.
-
Sapkota, A., Symons, J. M., Kleissl, J., Wang, L., Parlange, M. B., Ondov, J., Breysse, P. N., Diette, G. B., Eggleston, P. A., & Buckley, T. J. (2005). Impact of the 2002 Canadian Forest Fires on Particulate Matter Air Quality in Baltimore City. Environmental Science & Technology, 39(1), 24–32. https://doi.org/10.1021/es035311z
-
Moore, D. P. (2019). The October 2017 red sun phenomenon over the UK. Weather, 74(10), 348–353. https://doi.org/10.1002/wea.3440
-
Turóczi, B., Hoffer, A., Tóth, Á., Kováts, N., Ács, A., Ferincz, Á., Kovács, A., and Gelencsér, A. (2012). Comparative assessment of ecotoxicity of urban aerosol, Atmos. Chem. Phys., 12, 7365–7370, https://acp.copernicus.org/articles/12/7365/2012/
-
Danielsen, P.H., S. Loft, A. Kocbach, P.E. Schwarze, & P. Moller (2009). Mutation Research/Genetic Toxicology and Environmental Mutagenesis 674, 116-122. https://doi.org/10.1016/j.mrgentox.2008.10.014
-
Aguilera, R., Corringham, T., Gershunov, A. & T. Benmahrnia (2021). Wildfire smoke impacts respiratory health more than fine particles from other sources: observational evidence from Southern California. Nature Communications 12, 1493. https://doi.org/10.1038/s41467-021-21708-0